
Introduction
I remember standing at a depot while drivers swapped stories about long waits and missed runs — a small scene that captures a big problem. A pantograph charger can reduce dwell time dramatically; some field tests report turnaround cuts approaching 40–50% on high-frequency routes, and that changes scheduling math fast. (Fleet managers notice the bottom line first.) As an engineer who has spent nights troubleshooting power converters and contact wear, I ask: how do we move from a spot-fix mindset to real, measurable improvements across an entire fleet? This piece will walk through where old solutions trip us up and where practical upgrades can make the difference — then point toward real metrics you can use. Let’s move from the anecdote to actionable insight.
Hidden Friction: Why Traditional Charging Fails
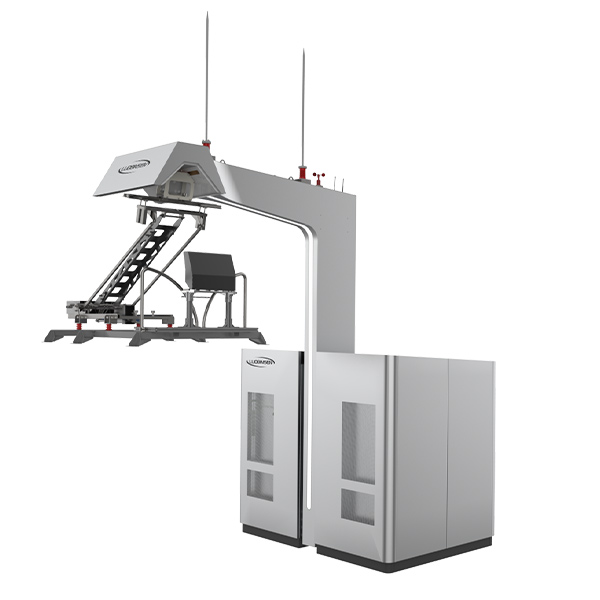
electric bus charging station designs grew from simple needs: transfer energy, top up batteries, get buses back on the road. But I’ve seen systems that still lean on patchwork fixes — slow interfaces, inconsistent power delivery and unpredictable maintenance windows. Technically, many legacy sites use bulky charge controllers and under-specified power converters that struggle with repeated, short high-current events. That creates grid harmonics and heat, which accelerate contact wear on current collectors. The practical result: more downtime, more parts orders, and timetable churn. I don’t mean to be alarmist — I mean to be practical. When a depot counts on a single protocol or a single supplier for connectors, flexibility disappears. Look, it’s simpler than you think: small design limits multiply across dozens of vehicles and suddenly your depot looks fragile.
Why do old approaches fail?
From my experience, failure points fall into a few clear buckets. First, mechanical mismatch: pantograph interfaces and overhead catenary tolerances age, and alignment errors show up as repeated maintenance needs. Second, electrical stress: inadequate transient suppression means repeated strain on converters during rapid charge cycles. Third, operational mismatch: schedules designed for long overnight charging don’t fit fast, opportunity-based charging models, causing queuing and lost runs. These are industry problems — DC fast charging, current collectors, and contact wear come into play — but they’re fixable once you stop accepting intermittent fixes as normal. We can map each pain point to a technical countermeasure; that’s the next section.
Future Outlook: Where Pantograph Systems Should Go
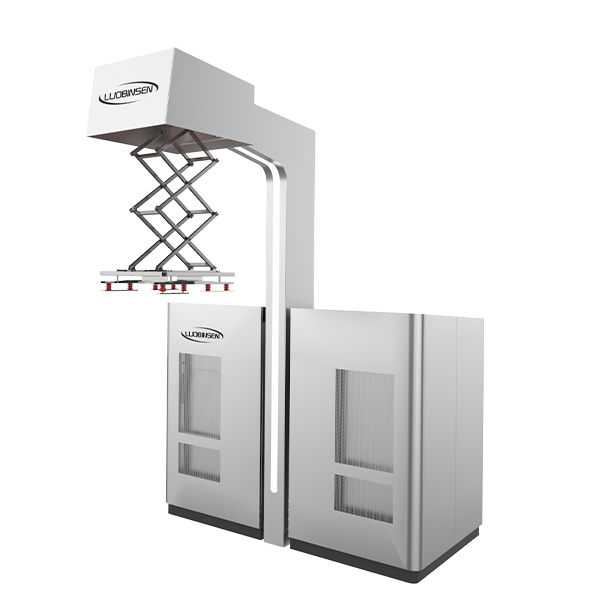
What’s next for pantograph systems? I see two clear directions: smarter control and modular robustness. Smarter means integrating edge computing nodes at the depot to manage load, balance energy across buses, and reduce peak draw from the grid. Modular means designing charging bays so a failed power converter or a worn pantograph head can be swapped with minimal disruption. Both reduce downtime and simplify maintenance planning — and both are within reach for most mid-size depots. Consider the pantograph ev charging system as one pattern among many: it’s not a silver bullet, but it shows how modular interfaces and smarter controllers can cut labor and extend equipment life. I’m optimistic — and cautious. Technology helps, but the human piece matters: training, clear maintenance protocols, simple parts lists. — funny how that works, right?
Real-world Impact
In several pilot projects I’ve been part of, moving to modular pantograph heads and smarter charge controllers cut unscheduled maintenance by roughly a third and improved on-time departures by a similar margin. That translates into route reliability you can measure: fewer late arrivals, fewer overtime hours, better passenger trust. When I talk with operators they care most about three things: uptime, simplicity, and predictable costs. If a new approach delivers those, adoption follows. The comparison is simple — and decisive — when you put hard numbers on operational hours saved and parts reduced.
Three Metrics to Choose By
To end on something you can use, here are three practical evaluation metrics I rely on when we assess upgrades: 1) Mean Time Between Failures (MTBF) for pantograph heads and power converters — longer is always better; 2) Depot throughput per charging bay (buses/hour) under peak schedules — this shows real capacity; 3) Total cost of ownership over five years, including replacement parts and labor (not just purchase price). Use these to compare options side-by-side. I’ve learned to trust numbers over promises, and you will too once you start tracking them. If you want a supplier reference or a pilot design to test, check out Luobisnen for components and case examples — I’ve discussed their modular pieces with colleagues and found the practical fit helpful.